Ayecka SR 1 - level below 0 dBm
Lower value means greater signal!
The statistics were last updated Sunday, 4 October 2026 at 3:49 GMT,
at which time the device had been up for 4 days, 10:40:48.
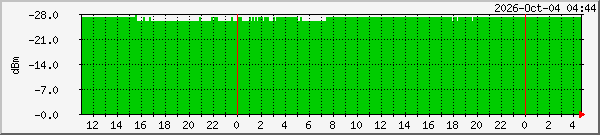
`Daily' Graph (5 Minute Average)
|
Max |
Average |
Current |
| level: dBm |
279.0 . |
267.0 . |
270.0 . |
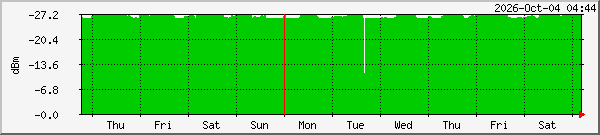
`Weekly' Graph (30 Minute Average)
|
Max |
Average |
Current |
| level: dBm |
271.0 . |
265.0 . |
270.0 . |
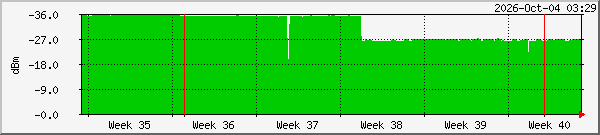
`Monthly' Graph (2 Hour Average)
|
Max |
Average |
Current |
| level: dBm |
360.0 . |
313.0 . |
270.0 . |
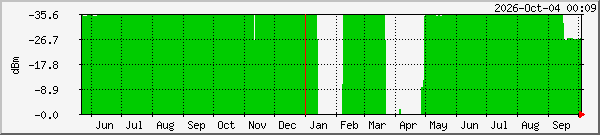
`Yearly' Graph (1 Day Average)
|
Max |
Average |
Current |
| level: dBm |
364.0 . |
344.0 . |
267.0 . |
| GREEN ### |
Level: below 0 dBm . A lower plotted value means a bigger signal! |


